Corrugator Steam Savings: Why One Plant Reports 32 % and Another 15 %
A corrugator in Bursa reports 32 % less steam; one in Rajkot held about 15 % less fuel over seven metered months. What explains the gap, and which number to expect on your line.
On this page
Two corrugators, the same technology, two very different numbers. A plant in Bursa reports about 32 % less steam. A plant in Rajkot held about 15 % less fuel per tonne over seven metered months. Neither number is wrong, and the gap between them tells you more than either one does alone.
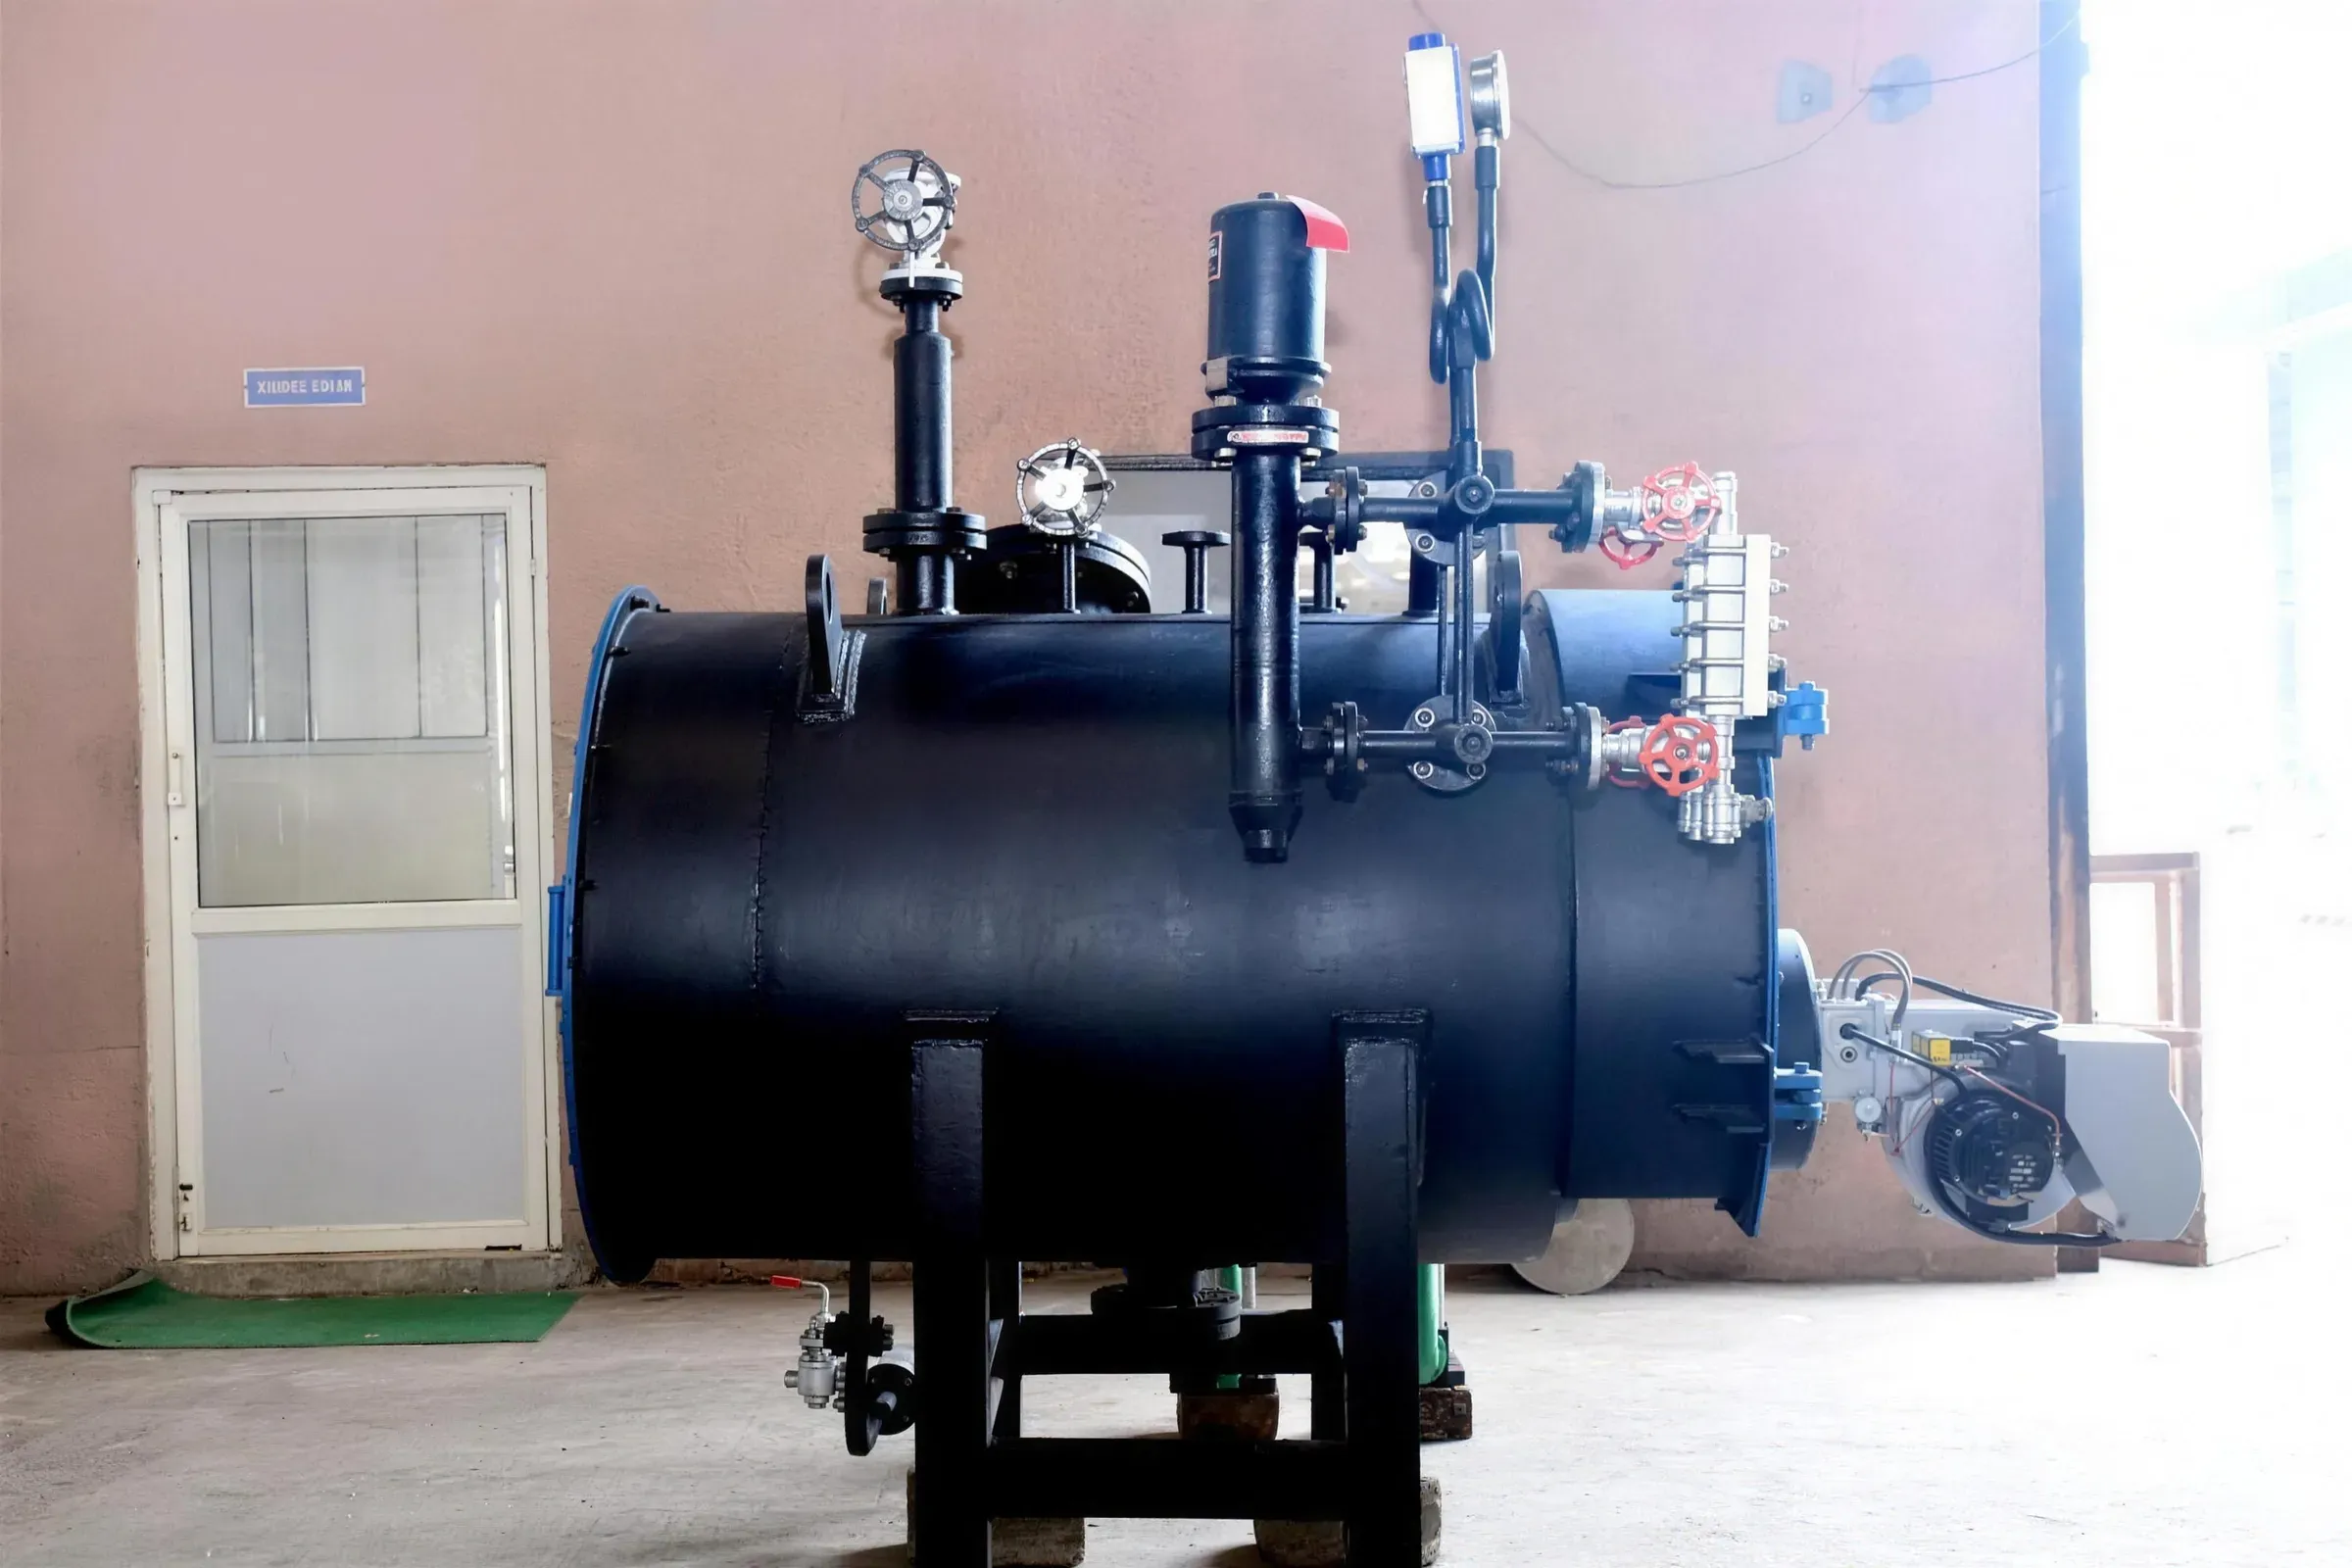
Both plants replaced the steam control on their corrugator with Jetomat thermocompressors, which pull the condensate and flash out of the plates and rolls and put the flash back to work in the steam supply. The equipment is the same idea in both. The difference is in what was measured, who measured it, and how much steam each plant was losing before.
The two numbers
| Bursa, Turkey | Rajkot, Gujarat | |
|---|---|---|
| What was replaced | Control valves and steam traps on the dryer groups | The pressure-reducing station and the steam traps; the five zone valves stayed |
| Who did it | Our partner Baelz | i-Kcal, installed with no downtime |
| The figure | About 32 % less steam in the dryer section | About 15 % less fuel per tonne, 20.6 % in the best month |
| Measured on | Steam to the dryer section | Fuel per tonne of product, at the boiler |
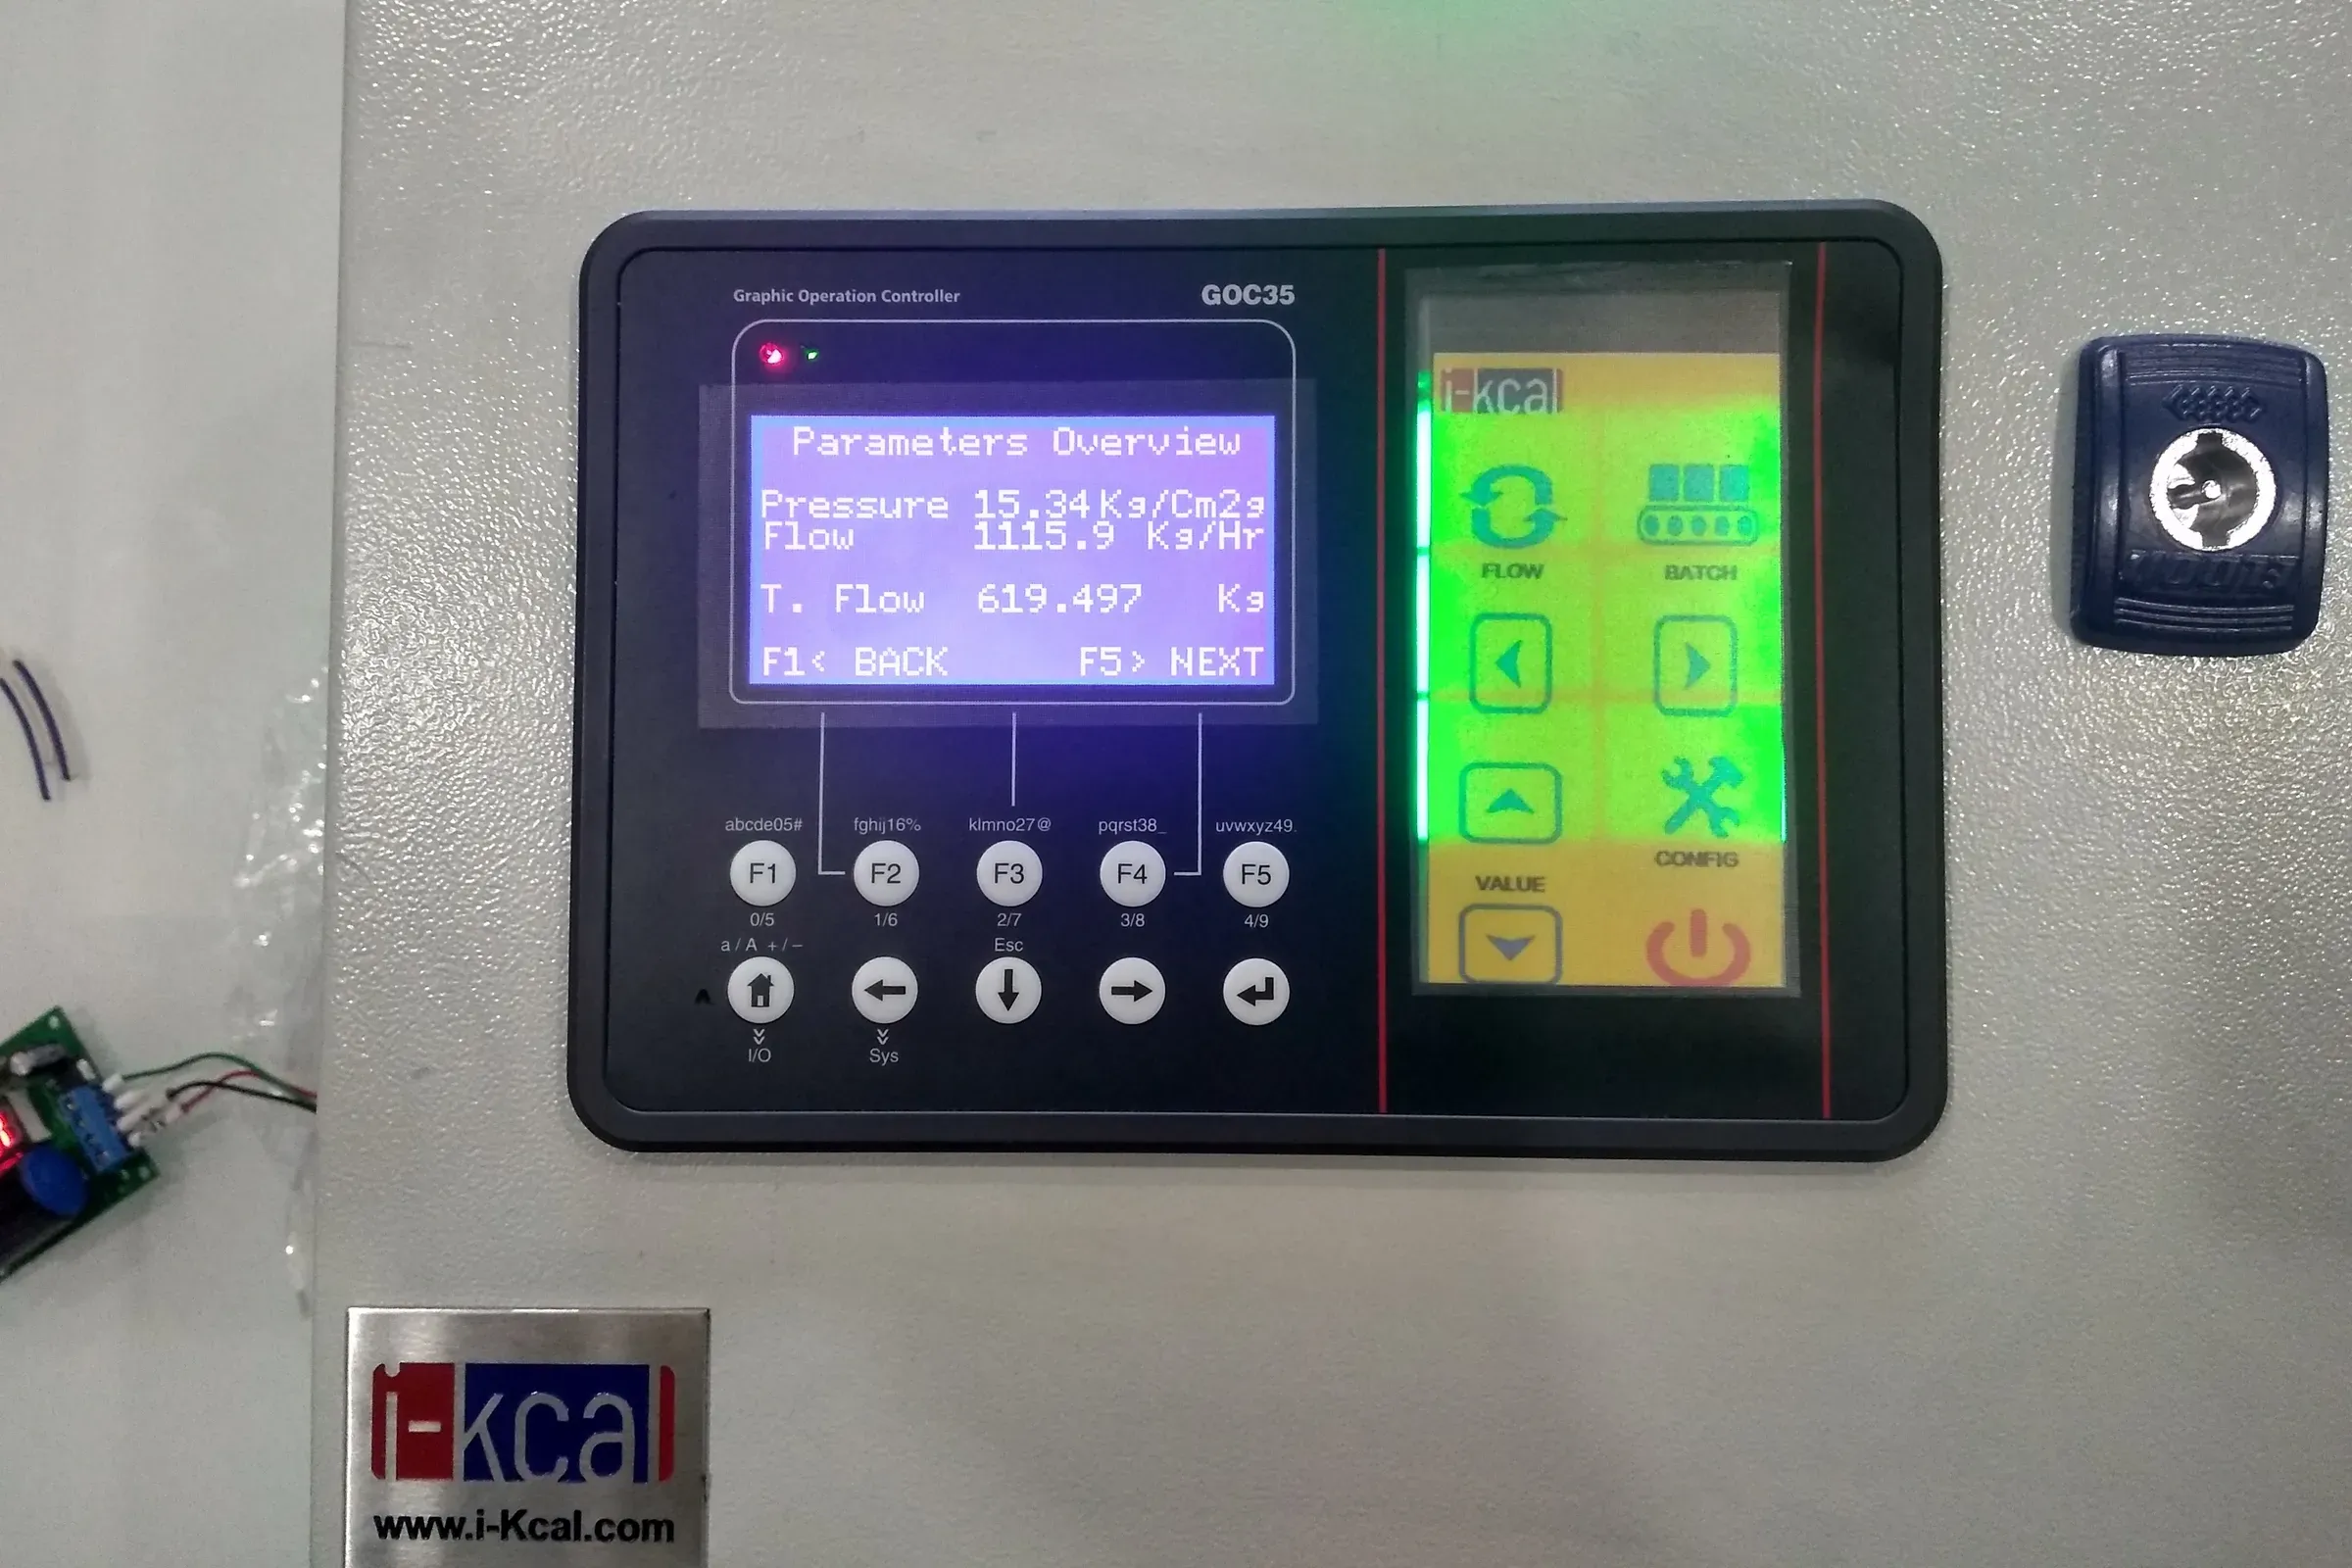
| Measured by | The customer, as reported | Monthly meter readings: 136 kg per tonne before, 113 in July, 108 in August |
| Over | As reported after the retrofit | Seven months after, against an eight-month baseline |
The full stories are in the case studies: Bursa and Rajkot.
Why the numbers differ
1. They measure different things. Bursa’s figure is steam into the dryer section. Rajkot’s is fuel per tonne at the boiler. The boiler also feeds loads the project never touched, and it has its own losses. A saving on the corrugator shows up smaller once it is spread over everything the boiler does. The same saving, measured at the dryer section, reads larger.
2. One is a best month, one is a held figure. Rajkot’s August was 20.6 %. The number we stand behind is about 15 %, because that is what held across seven months of normal running. Any project has a best month. The held figure is the one to plan on.
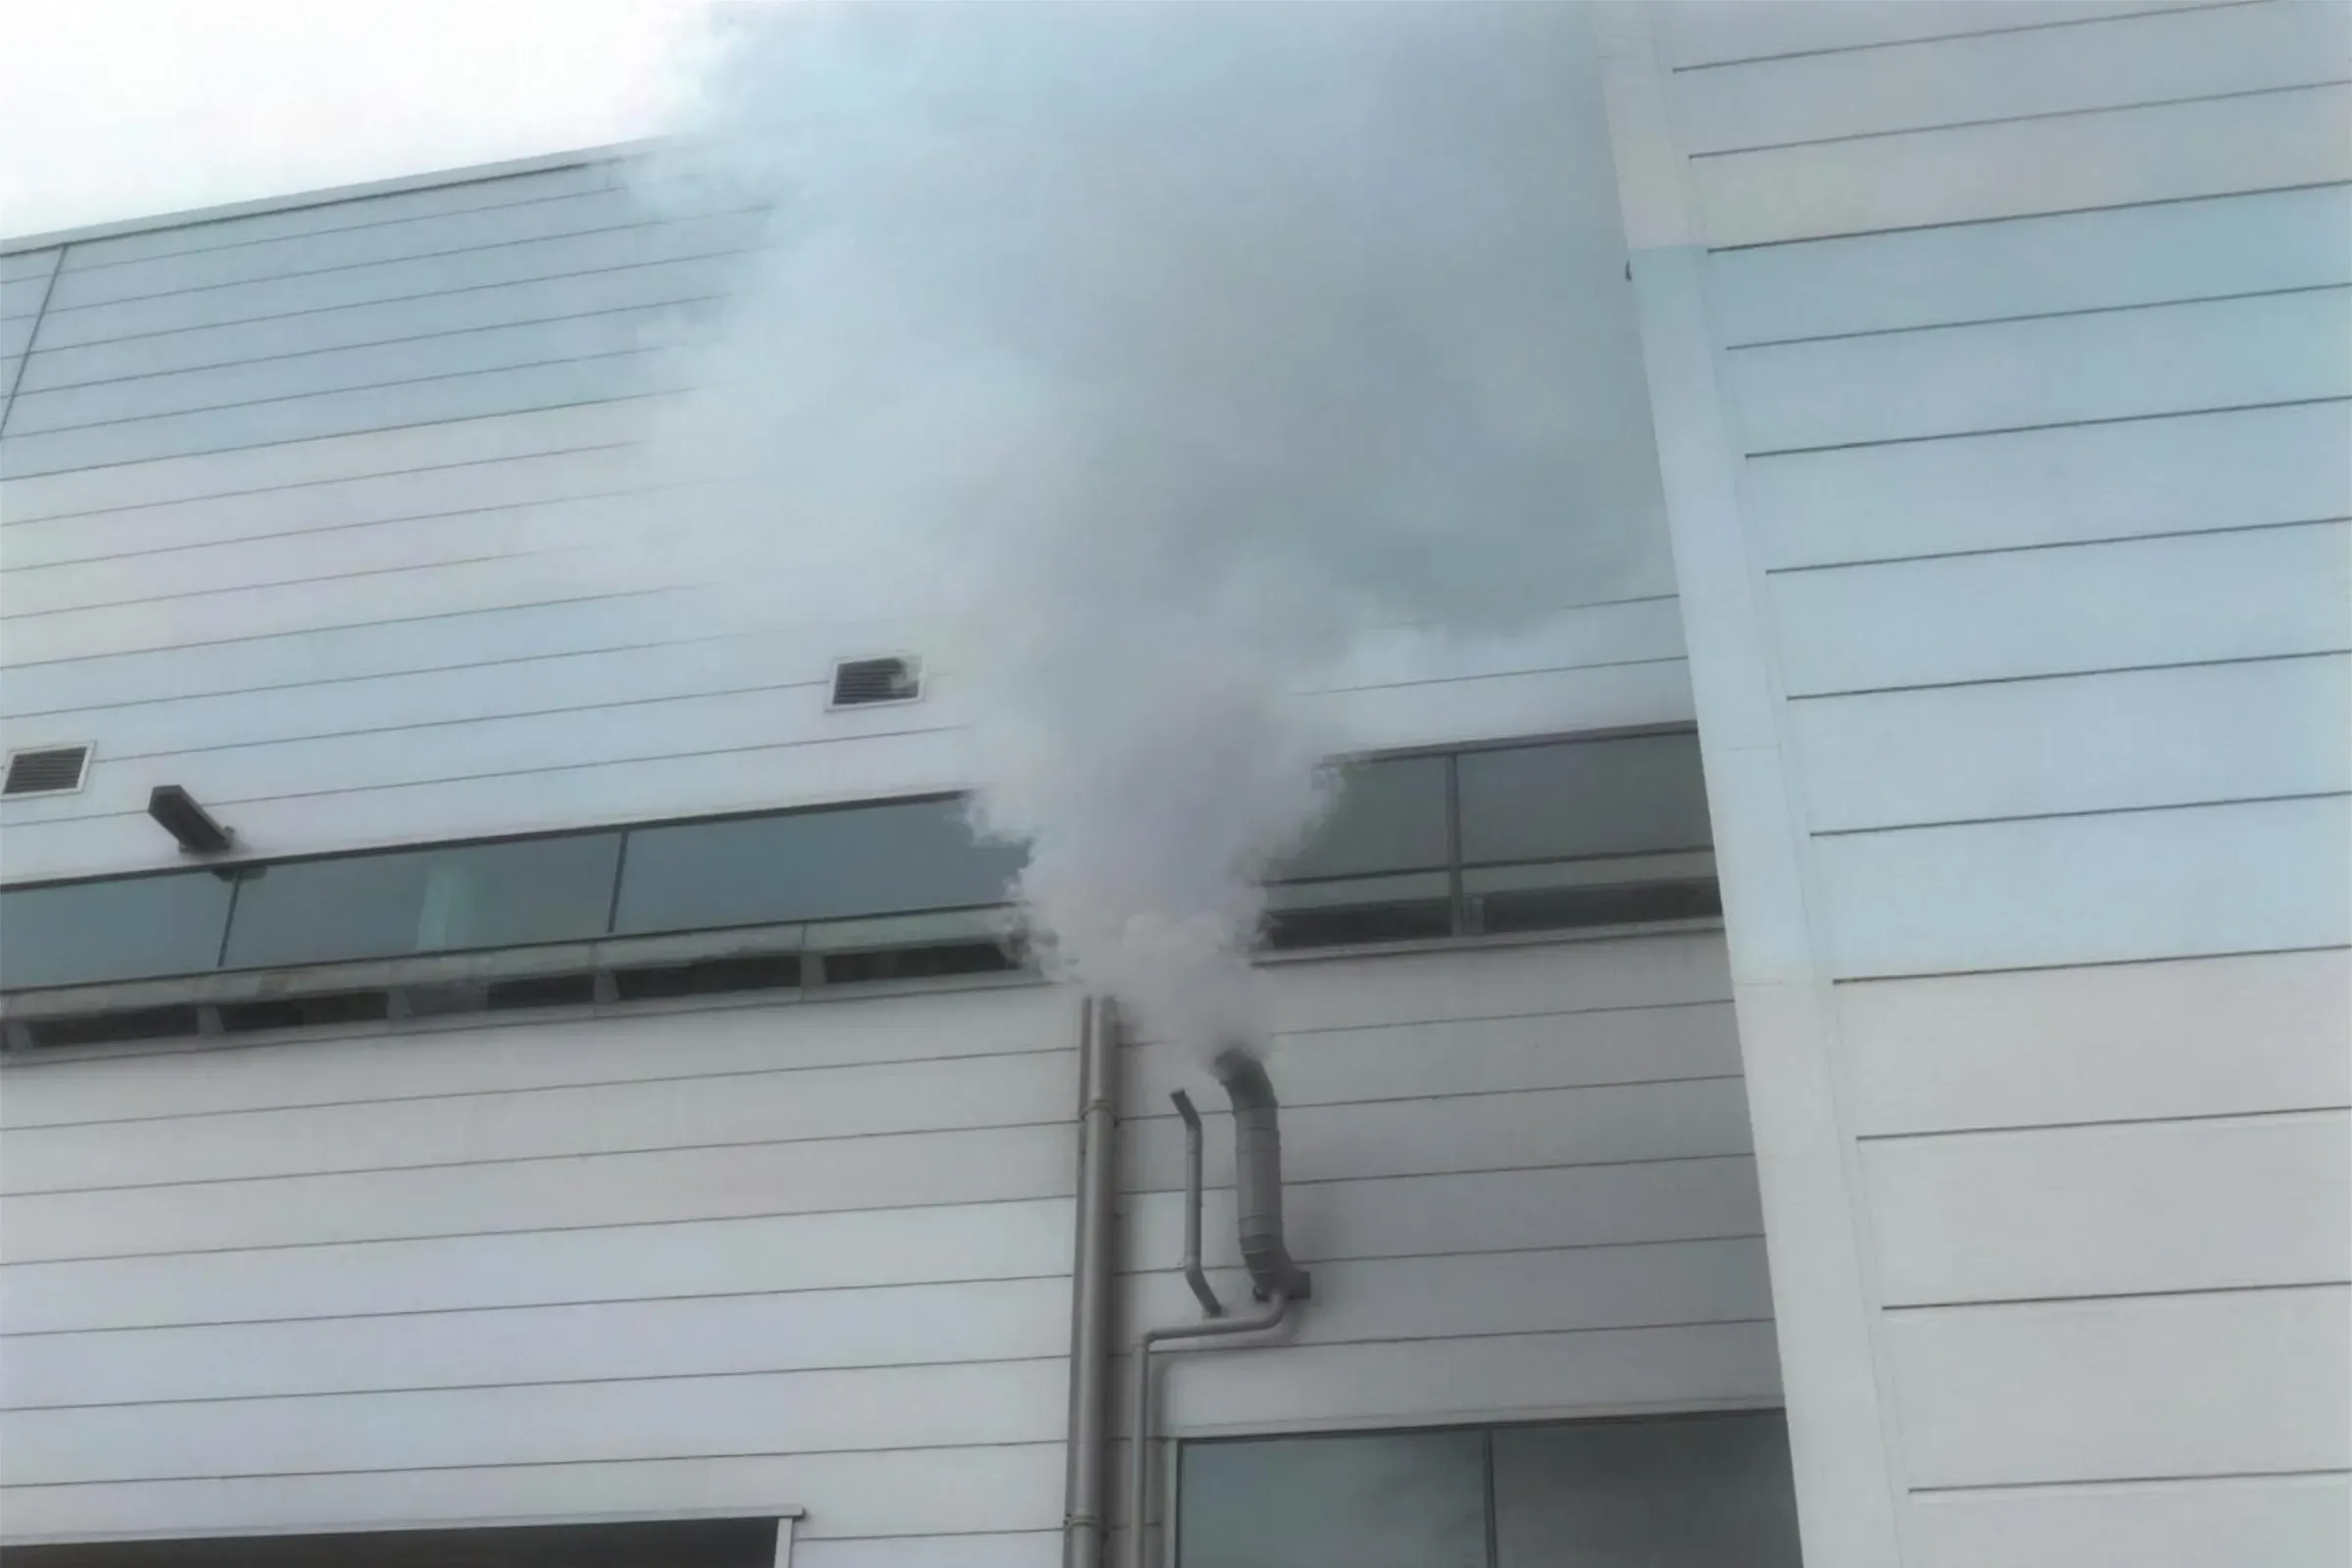
3. They started from different places. Look at the cover photo: that is Bursa’s roof before the work, with steam pouring off it. The same plant also reports about 80 % less feed water and chemicals afterwards, which tells you how much condensate and flash was going to air before. A plant that loses a lot has a lot to win back. A plant that was already draining and returning its condensate well starts with less to recover.
Which number to expect on your line
Your number depends mostly on how much your corrugator is losing today. Four quick checks:
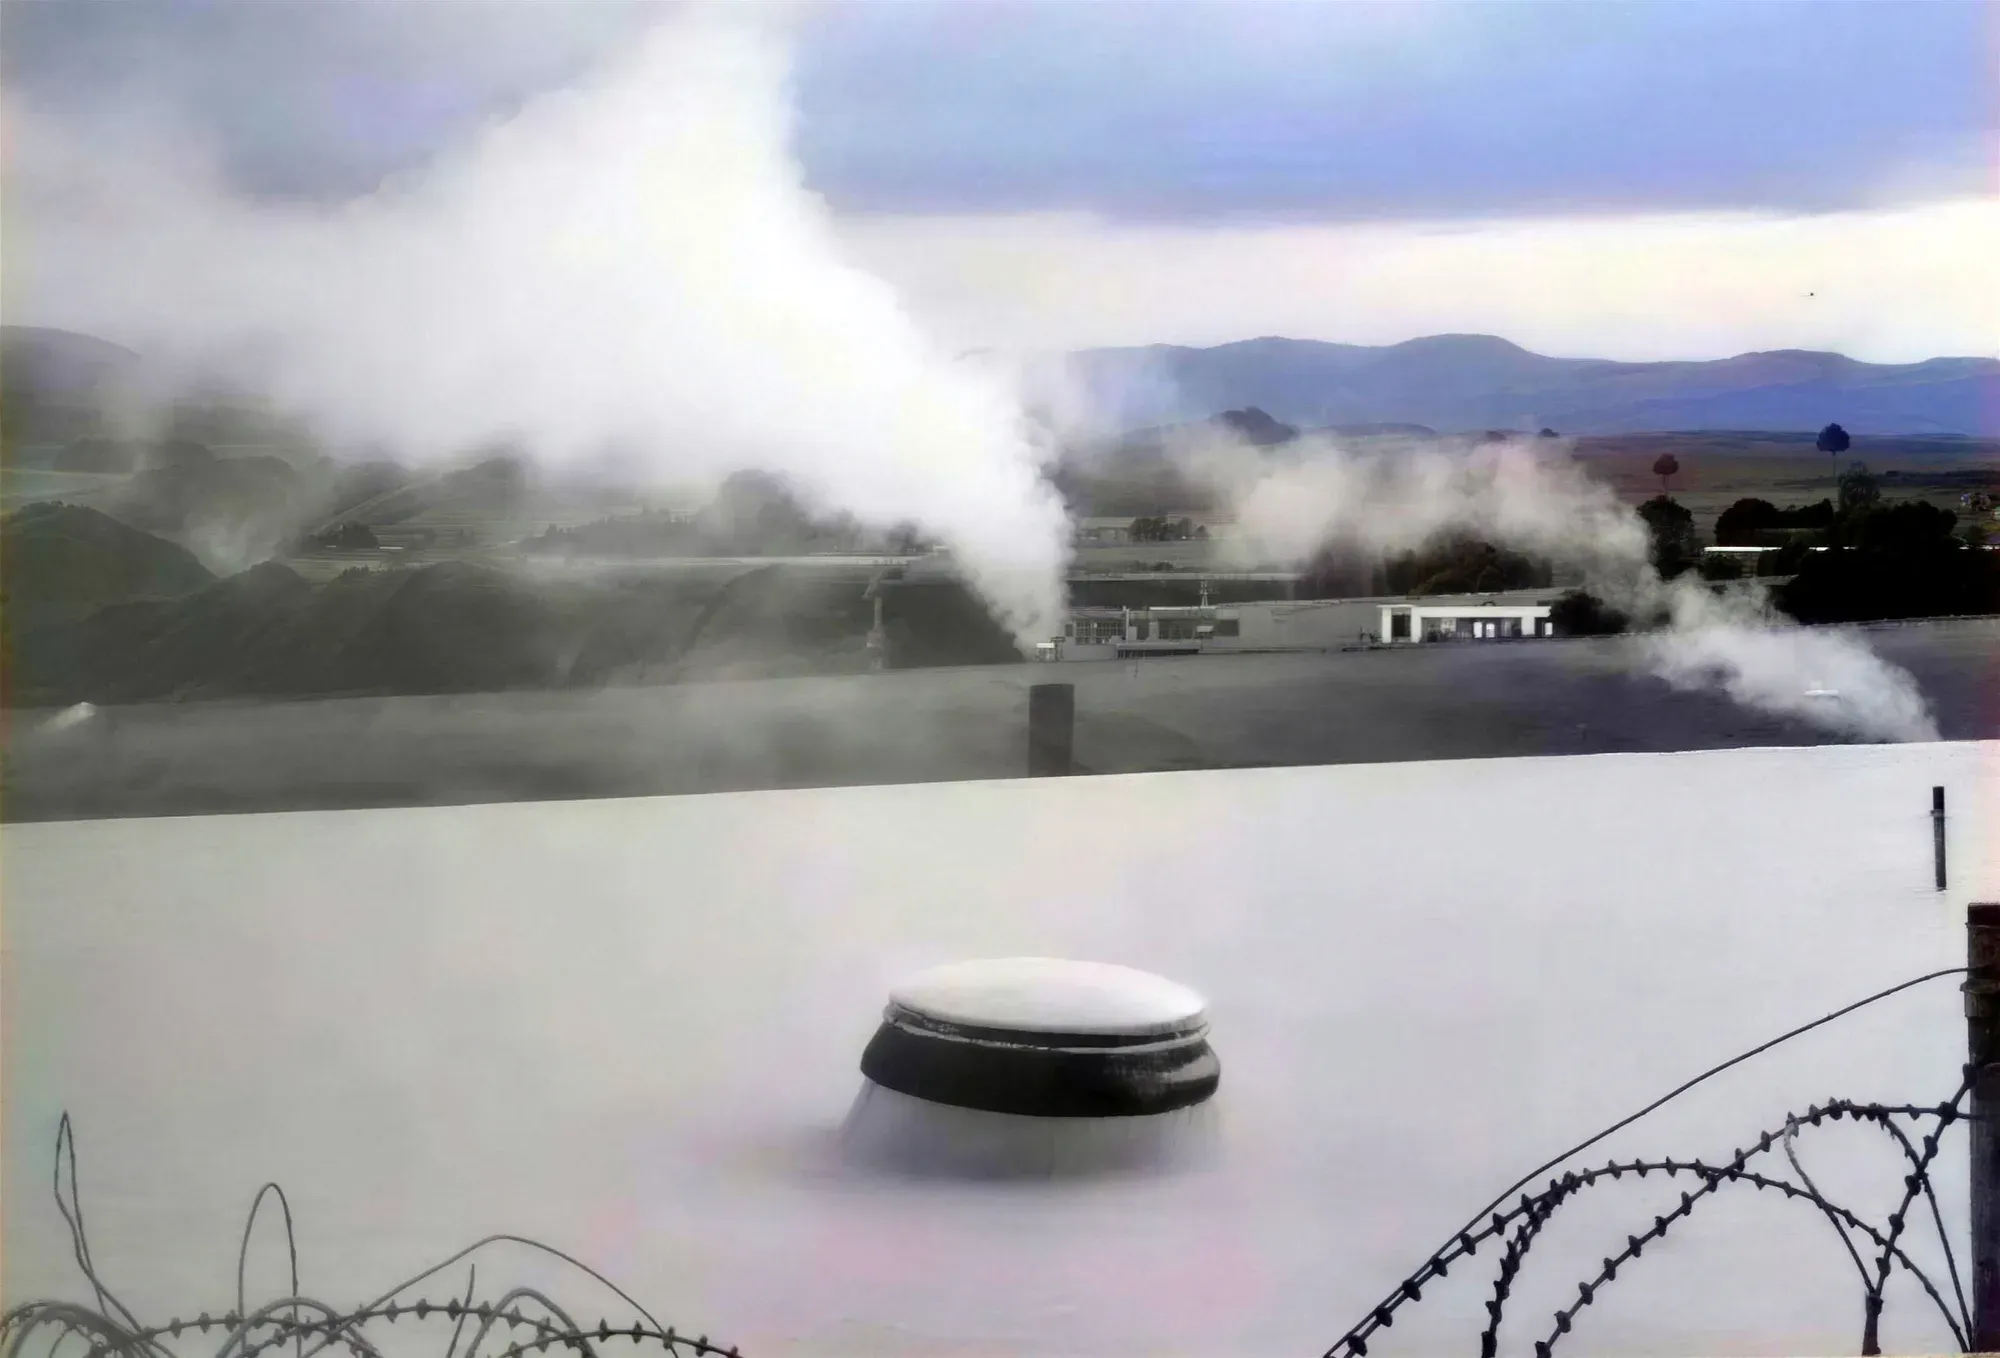
- Is there a plume? Steam over the roof, at the condensate tank vent or around the drain pit is recoverable steam going to air.
- How do the traps behave? A trap under every plate, with bypasses opened to keep the zones hot, is steam running straight to drain.
- How much make-up water does the boiler take? If make-up is a large share of the steam raised, most of the condensate is not coming back.
- How much of the boiler is the corrugator? If the corrugator takes most of the steam, a saving there shows up almost in full on the fuel bill. If it is one load among many, the fuel figure moves less.
Plenty of plume, traps on bypass and high make-up point towards the top of the range. A tight system that already returns its condensate points towards the bottom, and the honest first step may be trap and return work rather than a thermocompressor.
Measure it so the number means something
The way to know your own saving is the way Rajkot was measured:
- Fix the baseline before the work. Several months of fuel per tonne from the meters that will judge the result, agreed and written down in advance.
- Use fuel per tonne, not the fuel bill. Production goes up and down; per tonne takes that out.
- Judge it over several months. The held figure, not the best month.
The lesson on proving the savings walks through baselines, boundaries and how to correct for production.
What we need from you
Your monthly fuel per tonne for the last six months or more, the boiler make-up water if you log it, the steam pressure at the corrugator, the number of plates and traps, and a photo of the roof and the condensate tank vent. That is enough to tell you which end of the range your line is likely to sit.
FAQ
Is the 32 % a measured figure?
It is the customer's own figure for steam used in the dryer section, on a project by our partner Baelz. We publish it as customer-reported.
Why does the Rajkot case say about 15 % when one month reached 20.6 %?
Because a best month is not a result. About 15 % is what held across seven metered months against an eight-month baseline; 20.6 % was August alone.
Do the zone temperature valves go?
Not necessarily. In Rajkot the Jetomat took over from the pressure-reducing station and the steam traps, and the five zone temperature control valves stayed.